I will be starting a
series of Machine Learning Algorithms and gradually take over to advance level
and encourage everyone to learn Machine Learning and Artificial Intelligence
Algorithms and apply them in the real-world problems.
To start with, I
would like to start from the real basics of Statistics like : Mean, Median,
Standard Deviation, Quartiles & Percentiles. This will help to have good
basics around simple statistics.
Of course, we all would have learnt in our High School classes.
However, this will brush up our learning to go through and
understand what they mean and how they are derived.
Mean :-
Mean value or Mean is the average value of any given data set. This is
simple, but, why do we need Mean ? what is the use of mean ? Mean is termed as Representation of any given
data set.
For Ex :- the weights of students in a class. So, now,
if this data set has to be summarized, we usually take the average that data-set
and represent as an average weight of that class is = X Kgs / pounds.
So, Mean is
generally used as the representation of any given data set.
Statisticians often
refer to the mean and median as measures of Central tendency
How do we calculate
Mean ?
Mean = ( Sum of
observations ) / Number of observations => Average of the data set OR Mean of
data set
Formula for calculating mean is :-
Mean is often termed as mu ( μ )

ranging from 1 to where being the number of observations of a
given data set.
Median :- Median is
similar to mean, with the data arranged in ascending order and then choose the
mid-point of the No. Of Observations.
If, the ( Count of Observations ) is an odd number, it is fairly easy to find
the median = middle value.
Sample
Median = X( ( n + 1) /2 ), where n is odd,
If the ( Count of Observations ) is even, then, median = sum of two middle values / 2
Sample
Median = 1/2 X (n/2) , 1/2 x ( (n+1)/2),
where n is even
The Sample Median is
mostly preferred over Sample Mean, especially, if the data is asymmetric, i.e.,
if the data is not balanced and if there are too many outliers that is not
balancing the data to measure the central tendency.
Couple of important
differences between Mean and Median are :-
Mean
|
Median
|
Average of the
data set and also called / known as Center of distribution
|
The mid-number of
the set of numbers arranged / sorted in ascending order
|
Minimizes the sum
of squared deviations i.e., Sum of the squares of the deviations ( Squares of
each observation when subtracted from Mean ) is less when compared to sum of
squares of deviations from Median
|
Minimizes the sum
of absolute deviations I.e., Absolute sum of deviations ( sum of the
every observation after subtracting from Median) is less when compared to
absolute deviations from Mean.
|
Note:- #2 holds good for the data which has outliers and where there's a significant difference between Mean and Median, else, if mean and median are almost same, then the sum of squared deviations of mean and sum of absolute deviations of Median will be close to each other.
Standard Deviation
:- is the deviation of every observation from the mean value. Standard
deviation is the square root of sum of squares of the difference between mean
and every observation of the data set, given by the formula.
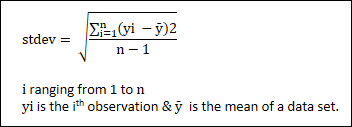
i ranging from 1 to n and Yi is the ith observation & is the mean of a data set.
Inter Quartiles Range IQR :- Interquartile Range is a measure of
statistical spread of the difference between 75th and 25th percentiles, or
between upper and lower quartiles, IQR
is calculated as
IQR
= Q₃ − Q₁.
IQR is also called
the mid spread or the middle 50% of the data or the H spread.
How to compute the
IQR :-
- Sort the data in ascending order
- Find the Median ( Q2 )
- Find Medians of both upper half ( Q3 ) ( 75th percentile ) and Lower half ( Q1 ) ( 25th Percentile )
- IQR is the difference between Q3 & Q1.
Below diagram shows different Quartiles and to find IQR

Q2
= Median
Q1
= Lower half median
Q3
= Upper half median
Outlier : An outlier is an
observation point that is distant from other observations. An outlier may
be due to variability in the measurement or it may indicate experimental error.
Outlier can be identified as Values >
Q3 +1.5 * (IQR) & < Q1 - 1.5 * (IQR) of a given data set.
Cheers,
:-Deepak
